Transaction metrics gives you a detailed report on individual transactions, its performance, ways to improve your most failed and slowest transactions, and explore into each transaction with performance breakdown, layers, and other services. It has been made easier to explore your transactions in a tabular form for easy understanding.
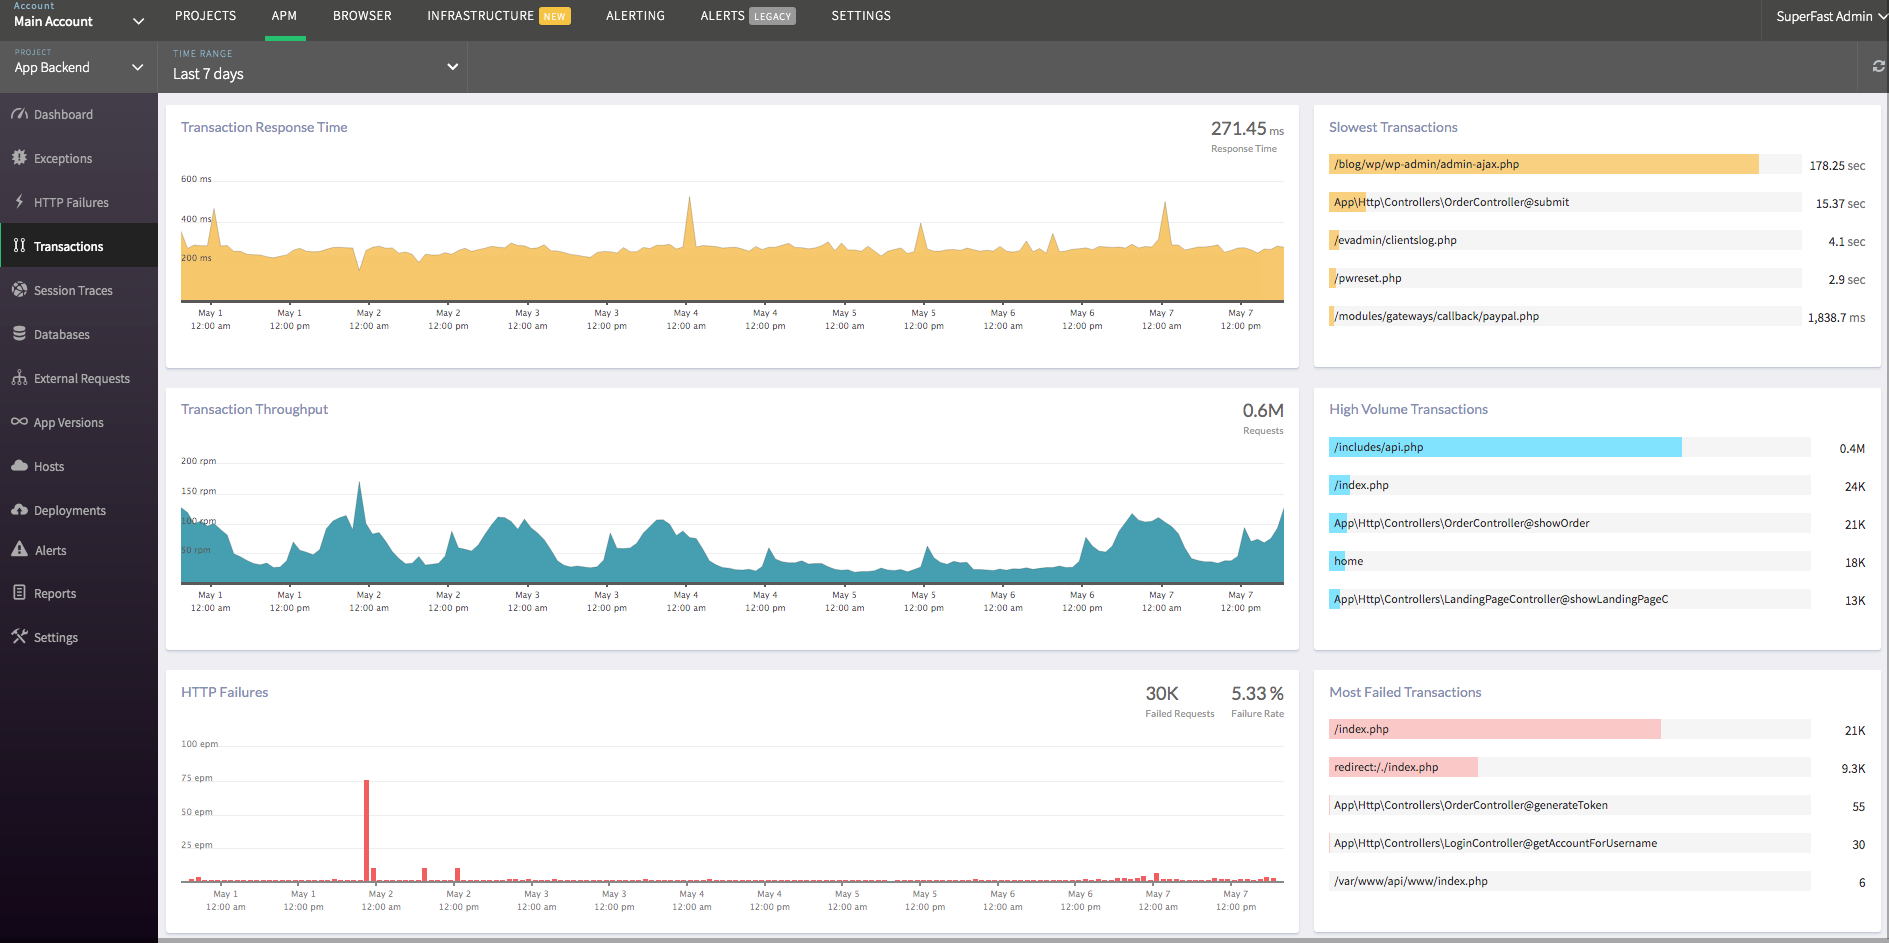
Transaction Response Time
Response time is an average of the total time spent across all web transactions happening within a selected time frame on the server-side. High application response time impacts application performance and is often caused due to latency and resource dissension issues.
Slowest Transactions
Captures the slowest performance of transactions from various locations and visualizes how to increase the overall performance of your app.
Transaction Throughput
View the transaction throughput to discover specific details around each individual transaction, where time is being spent in transaction traces.
High Volume Transactions
High volume transactions will provide data about the performance of your web app and other services.
HTTP Failures
Look into your HTTP failures to know the areas where the errors occurred with the specific time range.
Most Failed Transactions
It will display a summary about the most failed transactions in a waterfall view.
 +1-415-800-4104