Introduction
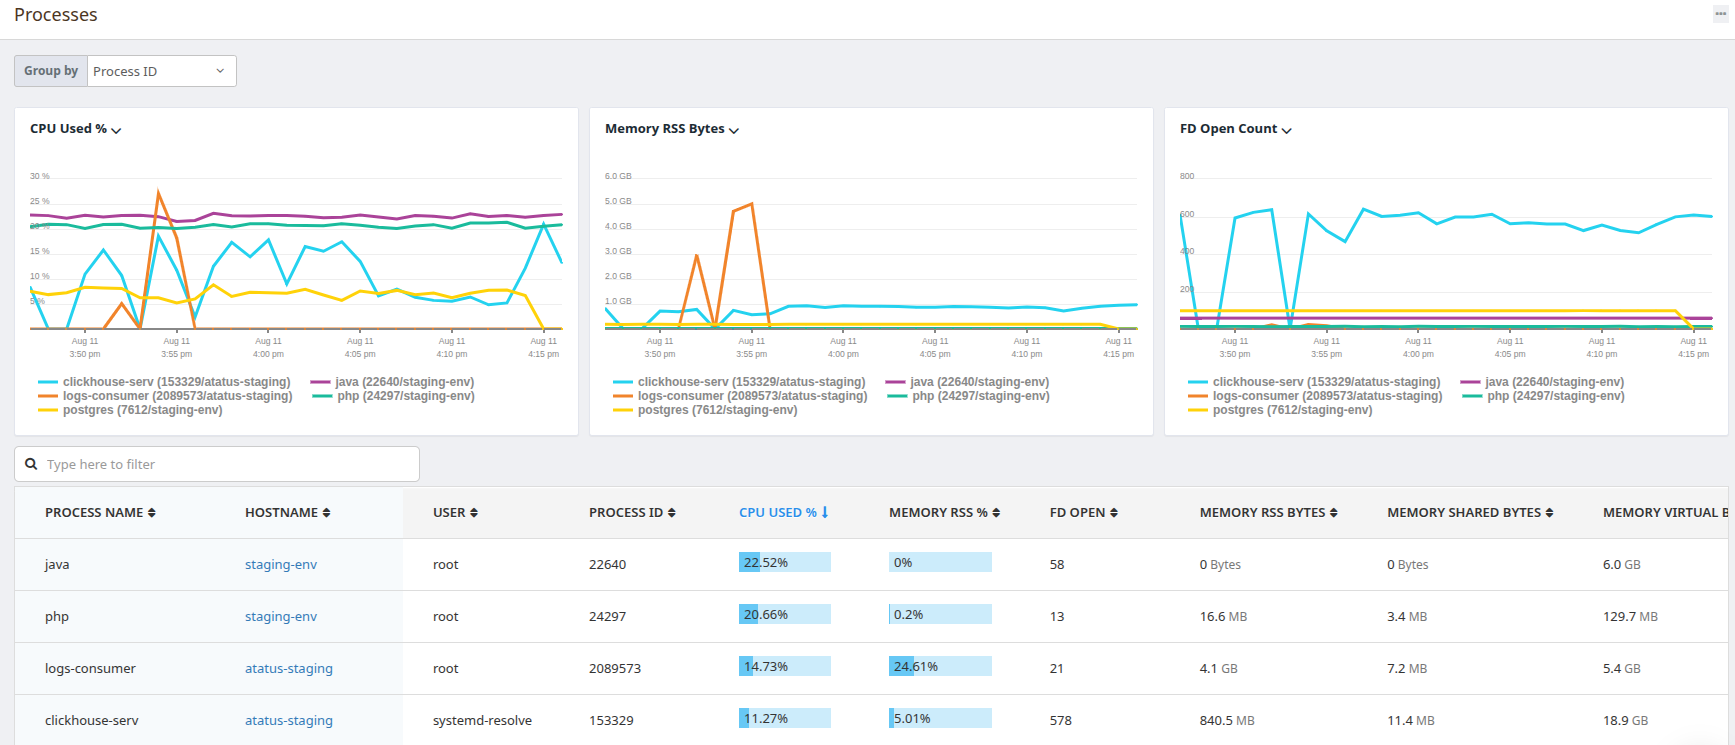
Atatus Processes provides real-time visibility into all processes running across your infrastructure. With Atatus Processes, you can:
- View and search all running processes.
- Monitor CPU, memory, and I/O usage.
- Filter by host, container, service, or tags.
- Track apps with second-level metrics.
- Add process context to dashboards and alerts.
Processes continuously collects process-level metrics and metadata from your hosts and containers, giving you deep insight into the resource consumption and performance of each running process.
Setup & Configuration
The process plugin is included with the Atatus Infra agent by default, please follow the below section to enable.
Copy the system example configuration file.
copycd /etc/atatus-infra-agent/conf.d/system.d/ sudo cp system.yml.template system.ymlUpdate the file
/etc/atatus-infra-agent/conf.d/system.d/system.ymlwith the following configurations:copyprocess: enabled: trueAfter updating the configuration, restart the Atatus Agent:
copysudo service atatus-infra-agent restart
Processes in Dashboards
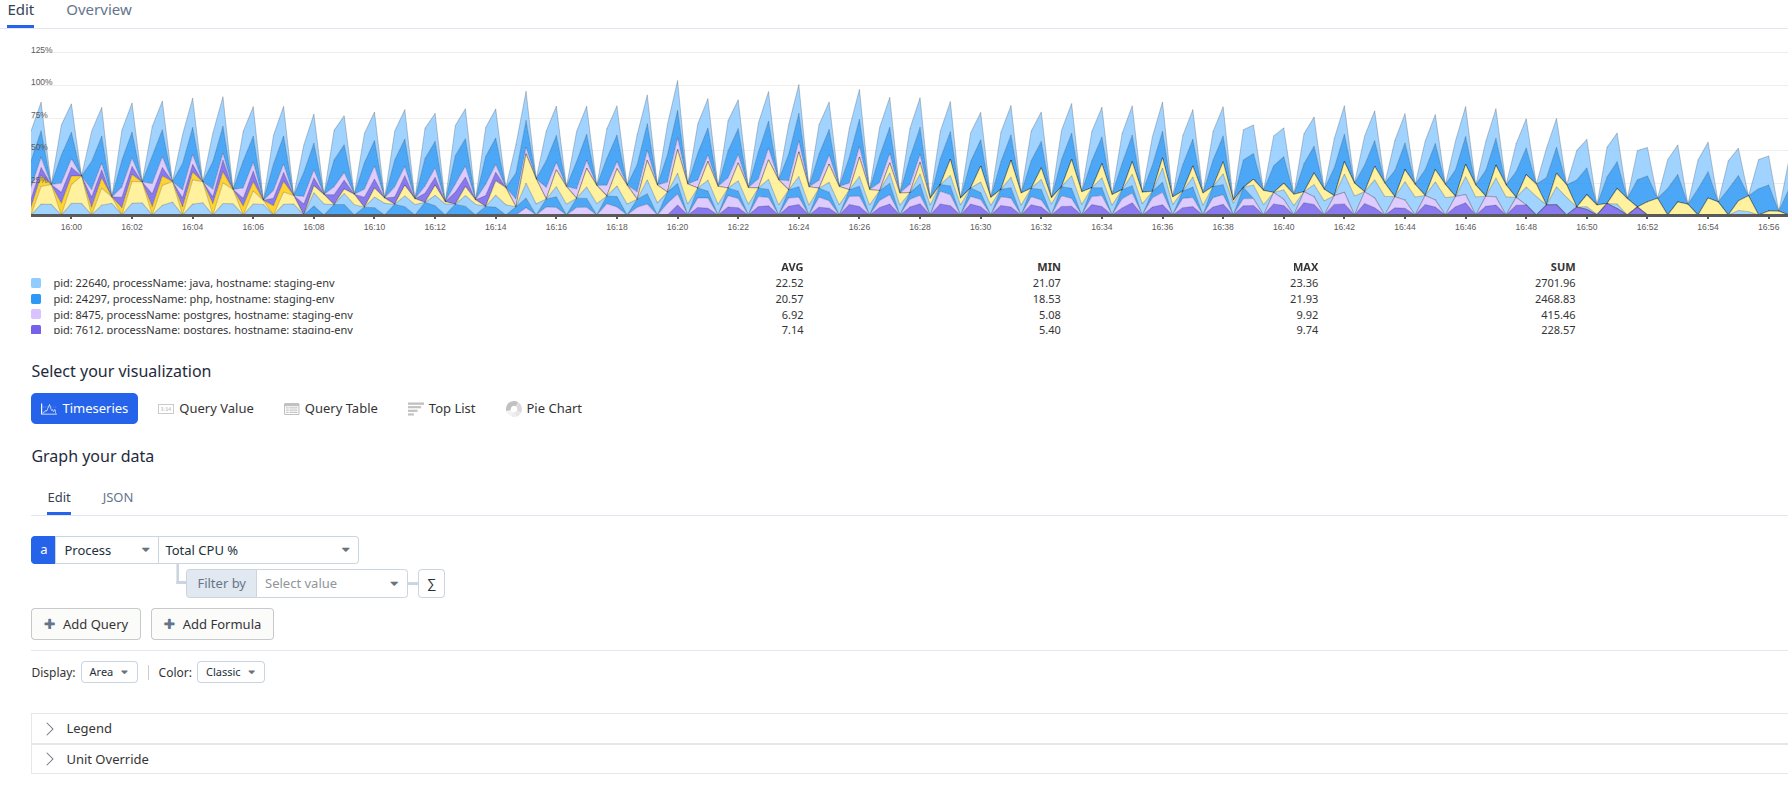
You can visualize process metrics in dashboards using the Timeseries widget.
Steps:
- Select
Processesas the data source. - Use the search bar to filter by process name or keyword.
- Choose a process metric to display (e.g., Total CPU %, RSS memory).
- Apply tag-based filters in the filter by field for more precise results.
- Save the widget to your dashboard.
 +1-415-800-4104