The ICMP Checks tool is a troubleshooting tool that lets you determine if a remote host can be reached over the internet or not, tests connectivity between the network devices and also tests if there is any network delay or packet loss happened in your host.
Metrics measured in ICMP checks include: * Latency * Packet Loss
Steps to configure the ICMP check:
Log in to Atatus. Then choose Synthetics from the dashboard.
To create the New check click on Create a New Check and select New API/Web Check.
1. Define request:
i) Choose the type of request as ICMP method in the drop down menu.
ii) Define your request:
- Provide the domain name or IP address to run your test on.
- Enter the number of Pings to trigger per test session. By default, the number of Pings is set to four. Depending on your needs, you can alter this number up to ten.
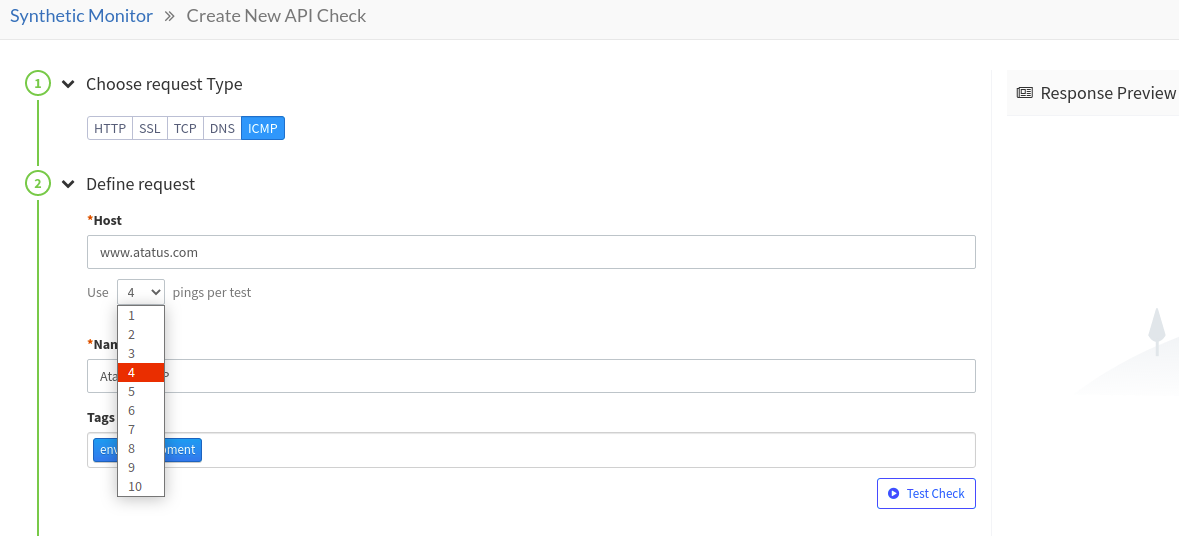
iii) Give your ICMP check a name. Your checks will be better organized if you add tags, so you can find them more easily in the dashboard.
iv) Try running a sample check by clicking Test check.
2. Define assertions
Upon clicking the Test Check button, you are automatically prompted with a basic assertion about the response from your server. It provides an indication of whether a check has been successful.
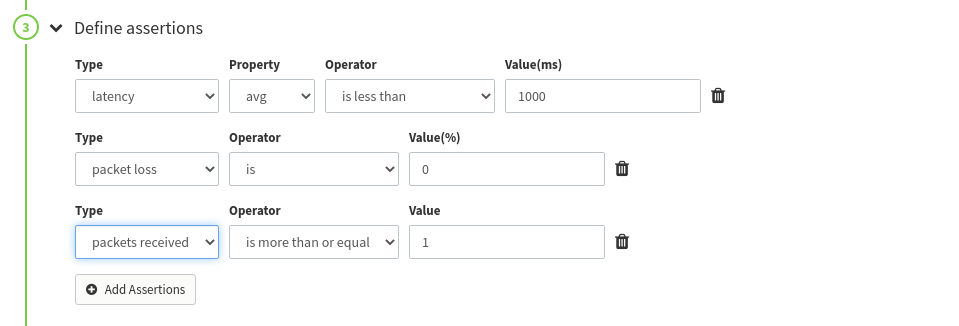
Every assertion can be customized. If you want to define your own assertion:
i) Click the Add Assertion button.
ii) Select the type and add the values accordingly.
Here are the list of types, operators and value types available in assertions.
| Type | Property | Operator | Value Type |
|---|---|---|---|
| latency | avg,max,min,stddev | is,is less than,is less than or equal, is more than, is more than or equal | Integer(in ms) |
| packet loss | is,is less than,is less than or equal, is more than, is more than or equal | Percentage(in %) | |
| packet received | is,is less than,is less than or equal, is more than, is more than or equal | Percentage(in %) |
3. Select Location
The locations can be selected one at a time or all at once. Select the respective location by clicking on the check box.
4. Set a frequency for testing
The frequency at which you want the check to run can be selected. The default frequency is once every minute.
5. Defining alert conditions
In defining alert conditions, you can make sure your check isn't triggered by intermittent network activity, so that you are only notified when your endpoint really has a problem.
There is a threshold amount of consecutive failures the location must experience before it is considered failed. You can set the retry count based on your preference.
Additionally, you can configure your check to notify when your endpoint goes down at a certain number of locations. The following alerting rule is set to send a notification if the check fails for three minutes on two different locations.
6. Notify your team
After creating alerts, specify any email address you want your check to send alerts to.
In addition, you can use integration channels such as Slack, PagerDuty, Microsoft Teams, webhooks and much more. Synthetic alerts are triggered after you set up the appropriate integration with the notification tools.
To setup:
i) You can set up new notification channels here by clicking the Setup new notification channels button.
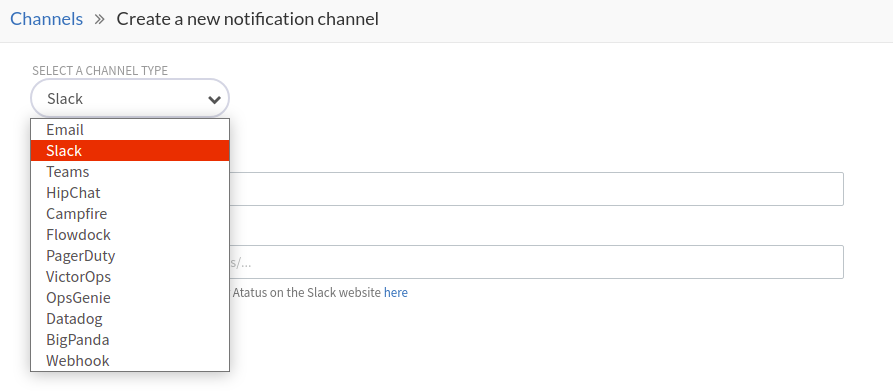
ii) In the Notification Channel section, click Create New Notification channel.
iii) Choose your desired channel type such as Slack, Teams, PagerDuty and so on.
iv) Provide all the necessary details.
v) Click on Create Channel.
Once you've completed your check, click on Create New Check.
 +1-415-800-4104