
Flow View visualizes your entire application stack and infrastructure as an interactive topological map. It reads the telemetry data you are already sending to Atatus and renders your architecture as a live graph—allowing you to trace request flows from services to databases, inspect Kubernetes clusters down to individual pods, and pinpoint root causes during incidents.
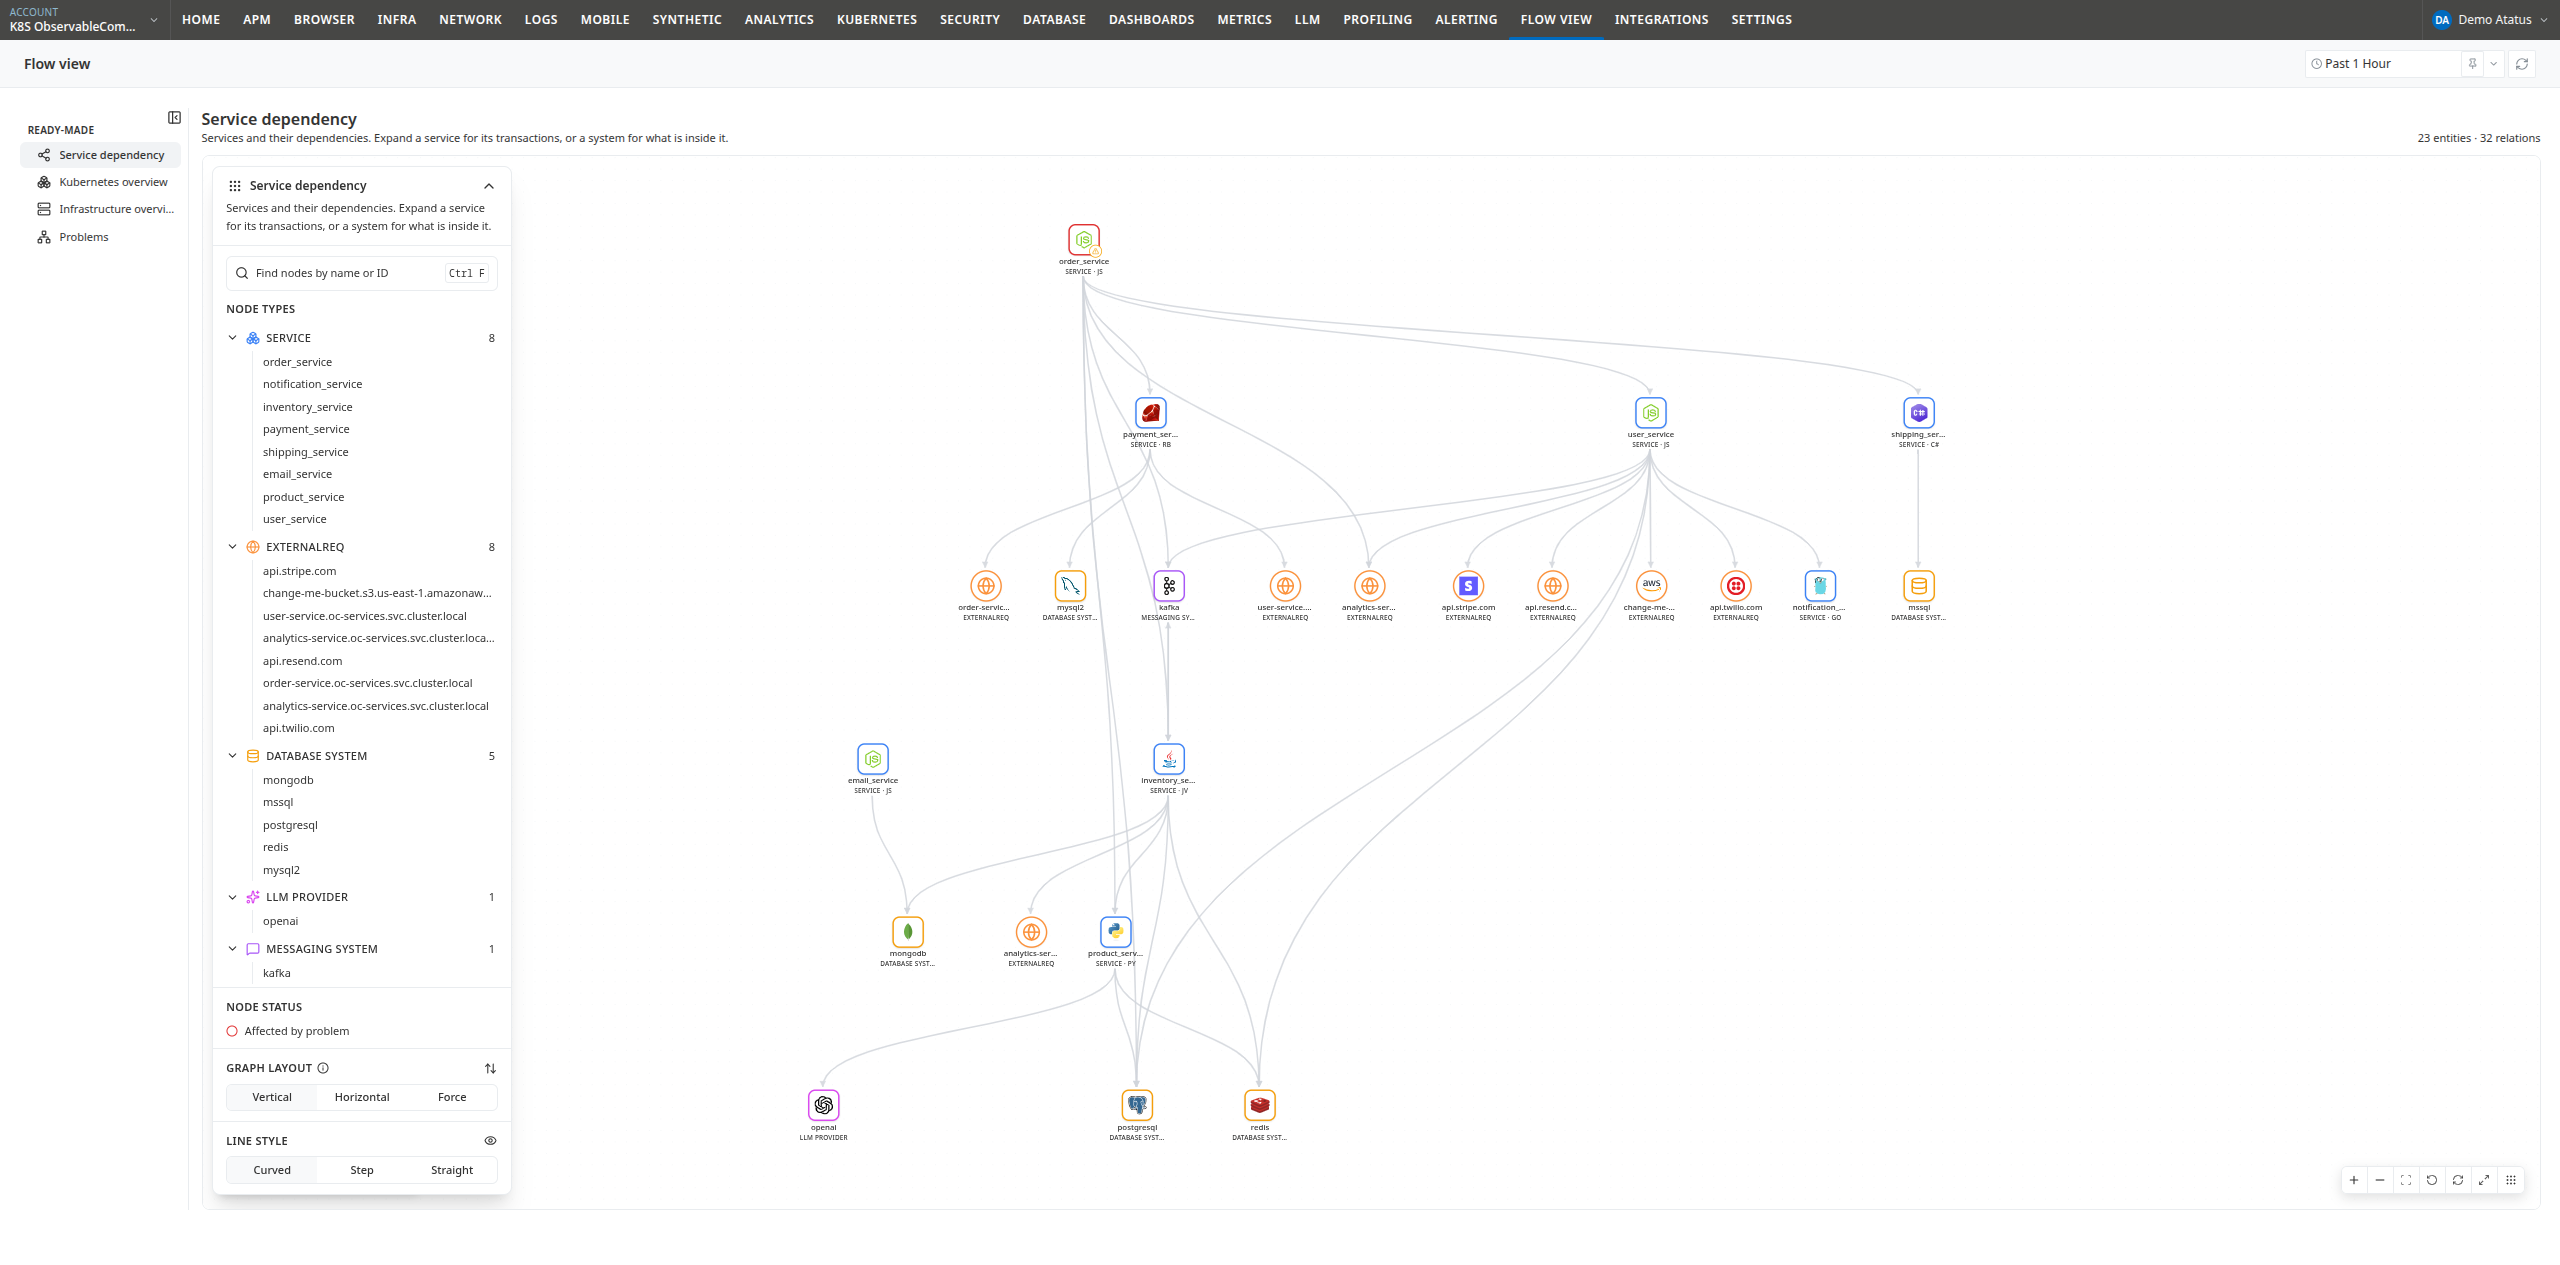
Flow View requires no separate agent installation. Any service reporting to APM, host running the Infrastructure agent, or cluster monitored by the Kubernetes agent appears automatically on the map.
Entities and relations
Flow View organizes your stack into two primary concepts:
| Concept | Description |
|---|---|
| Entity | An individual component in your architecture, such as a service, transaction, database, host, pod, cloud region, or Problem. |
| Relation | A directed connection or dependency between two entities, such as service-to-service calls, pod-to-node scheduling, or Problem root-cause links. |
Every entity has a type (e.g., Service, Host, Database System, KubernetesObject) that defines its icon and color, along with a unique entity key (e.g., service:68934040588fee5c7657a70b or host:atatus-qa). The entity key is displayed on the node info card and can be searched directly alongside display names.
Entities across all Atatus monitoring products are unified into a single graph. For example, a host monitored by the Infrastructure agent and the same host identified in an APM distributed trace resolve to the same entity key, linking application services directly to the underlying infrastructure.
The total count of currently rendered nodes and connections appears in the top-right corner of the canvas (e.g., 23 entities · 32 relations) and updates dynamically as you expand or collapse elements.
The four ready-made views
Flow View includes four preconfigured views accessible under Ready-made in the left sidebar:
| View | Starting Point | Best For |
|---|---|---|
| Service Dependency | Monitored services and external systems | Analyzing service call chains, upstream/downstream dependencies, and database/queue interactions |
| Kubernetes Overview | Monitored Kubernetes clusters | Navigating container containment hierarchies from clusters and namespaces down to workloads and pods |
| Infrastructure Overview | Cloud providers | Navigating physical and cloud infrastructure hierarchies from regions and availability zones down to hosts and disks |
| Problems | Active Problems | Pinpointing active incidents, identifying root-cause entities, and assessing blast radius |
Each view preserves its expansion state during your active session, allowing you to switch between views without losing your navigation context.
Health status and colors
Flow View visualizes health status across your architecture using node border colors:
| Border Color | Status Meaning |
|---|---|
| Red | The entity is identified as the root cause of an active Problem. |
| Amber | The entity is affected by an open Issue. |
| No color | The entity has no active Problems or open Issues. |
If an entity is both the root cause of a Problem and affected by an open Issue, it displays a red border (Problems take priority) along with an amber warning badge at the bottom right of its icon.
The node border indicates health status, while the internal icon retains the entity type color for clear identification.
Flow View highlights system topology and health states. To view quantitative performance metrics—such as throughput, response time, error rate, or Apdex—click through to the corresponding APM, Infrastructure, or Kubernetes monitoring dashboard.
Where the data comes from
| Entity / Scope | Source |
|---|---|
| Services, transactions, databases, message queues, external requests, LLM providers | APM agents via distributed tracing |
| Monitored database instances | Database Monitoring, unified with database nodes discovered by APM |
| Clusters, namespaces, nodes, pods, containers, workloads, volumes | Kubernetes Monitoring agent |
| Cloud providers, regions, availability zones, hosts, processes, disks, network interfaces | Infrastructure Monitoring agent |
| Problems and Issues | Alerting and automated Problem correlation |
Entities appear on the map once they report telemetry within the selected time range and disappear when telemetry ceases. Entities that have not sent telemetry within the selected window will not be rendered.
Time range
Flow View uses the global time picker located in the top-right header. Updating the time range dynamically refreshes the topology based on telemetry received during that window.
The selected time range persists as you navigate across the four ready-made views.
Next steps
- Navigating the graph: Learn how to select, expand, drill down, isolate, search, and customize layouts.
- Service Dependency: Explore service communication and dependency mapping.
- Kubernetes Overview: Navigate cluster containment from namespaces to pods.
- Infrastructure Overview: Inspect physical and cloud infrastructure hierarchies.
- Problems View: Investigate active incidents and root causes directly on the graph.
 +1-415-800-4104