
Opening a Problem from the list takes you to its detail page. This is where you investigate what happened, see everything it touched, and take action.
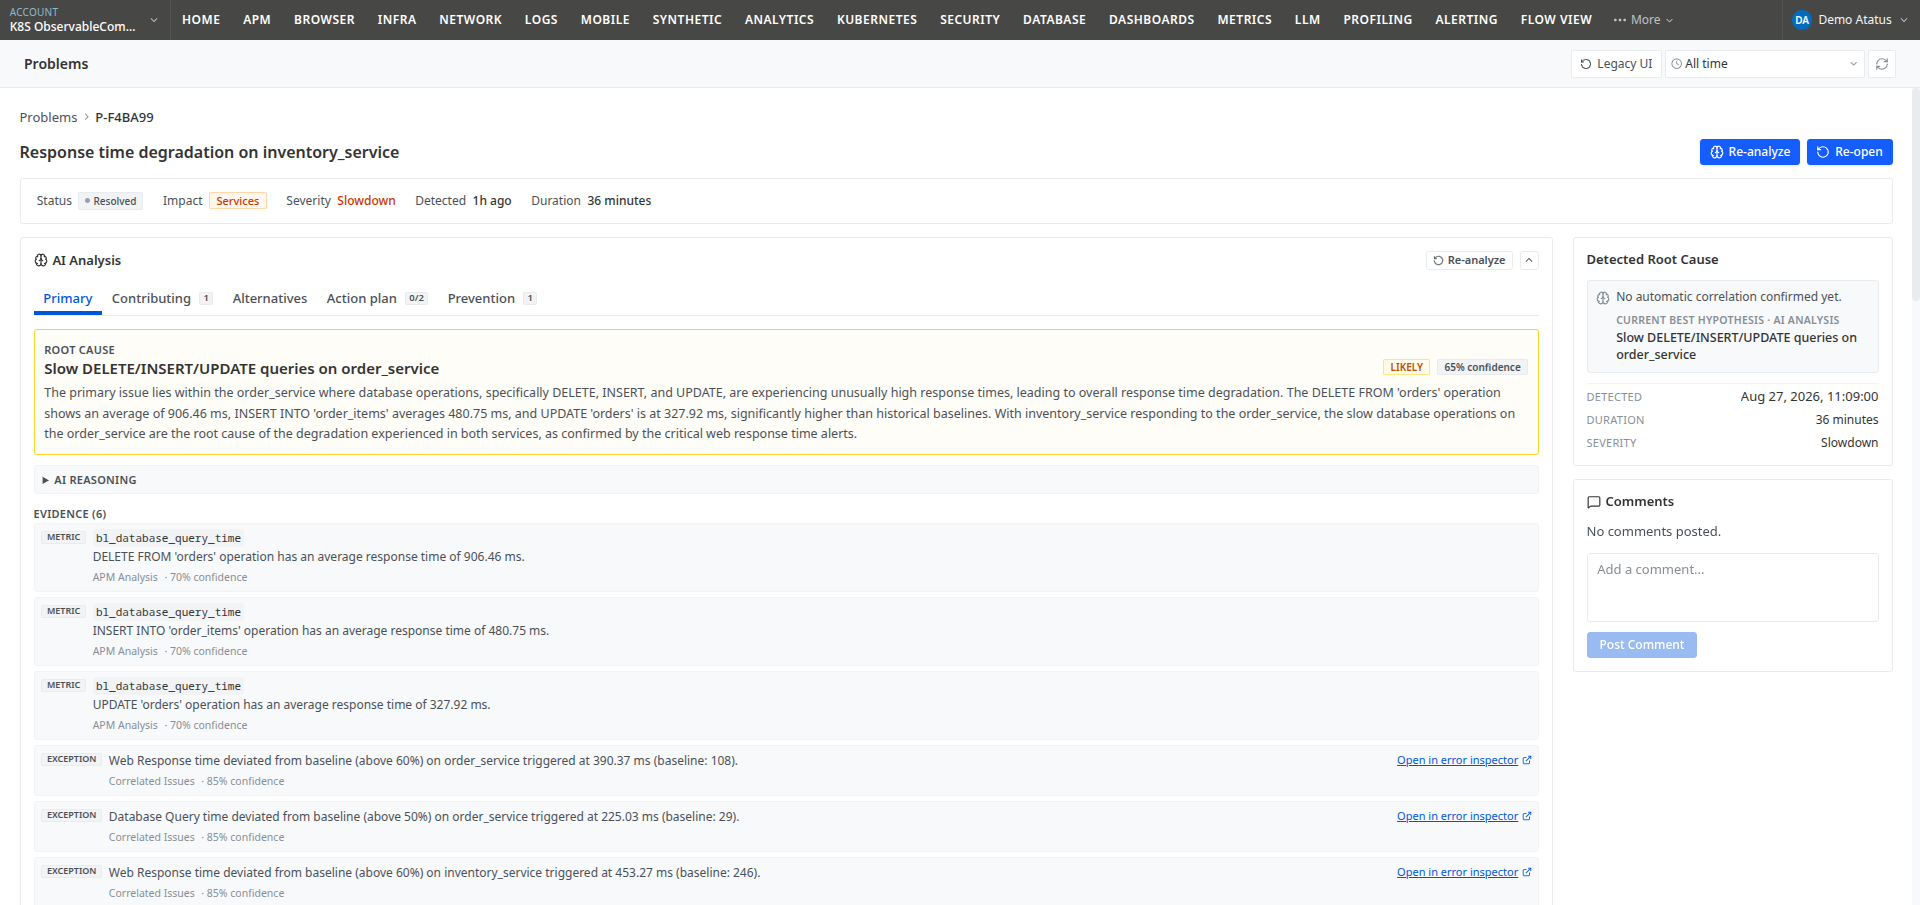
Header and actions
The header shows the Problem's title, its ID, and a breadcrumb back to the Problems list. The available actions depend on the Problem's status:
| Status | Actions available |
|---|---|
| Active | AI Analysis, Acknowledge, Resolve |
| Resolved | Re-analyze, Re-open |
- AI Analysis / Re-analyze: run or re-run the AI-powered investigation described in AI Root Cause Analysis.
- Acknowledge: mark the Problem as being worked on.
- Resolve: manually close the Problem.
- Re-open: bring a resolved Problem back to Active if it turns out the issue wasn't fully fixed.
Summary strip
Just below the header, a strip of fields gives you the essentials at a glance: Status, Impact, Severity, Detected (how long ago), and Duration.
Impacted entities
A row of counters shows how many Applications, Services, and Infrastructure components the Problem touches. Below that, cards list each impacted entity by name, along with its language or runtime (for a service) or its cluster and namespace (for a Kubernetes workload). Click a card to jump to that entity's own view.
Investigation panels
The middle of the page adapts to what kind of entity is impacted, so you get the metrics that actually matter for that Problem instead of a generic dashboard.
For a Problem impacting a service or application, you'll typically see:
- Top Slowest Endpoints: the endpoints with the highest average response time, along with request and error counts.
- Vitals: Response Time (average, p95, p99), Throughput, Error Rate, Apdex Score, Database Query Time, and Remote Response Time.
- Top Slowest Queries and Top Busiest Queries: the database queries most worth investigating.
- Top Slowest Remote Calls: the slowest calls to other services or external dependencies.
For a Problem impacting Kubernetes infrastructure, you'll typically see:
- Diagnosis: a plain-language summary of what happened to the pod or container, for example "was terminated (failed)".
- Container state: current state, restart count, and memory or CPU usage against limits.
- Vitals: the relevant infrastructure metrics, such as Warning Event Count, CPU Used, and Memory Usage.
- Top Warning Reasons: the most frequent Kubernetes warning events, with their message and last-seen time.
Correlated issues
The Correlated Issues section shows every underlying alert issue that makes up this Problem. A diagram at the top visualizes the entities involved and how they connect, for example a service calling another service, with the entity Atatus has identified as the root cause labeled directly on the diagram.
Below the diagram, a table lists the issues grouped by entity. Expand a group to see each issue's severity, status, the threshold that was breached, how long it lasted, and when it opened, with each issue tagged as either root cause or symptom.
Detected root cause
The Detected Root Cause panel on the right reflects what Atatus has confirmed automatically, separate from any AI analysis you've run. It shows one of the following:
- The confirmed root cause entity, once automatic correlation has identified one with confidence.
- A message that automatic correlation hasn't confirmed a root cause yet, along with a prompt to run AI Root Cause Analysis, and the AI's current best hypothesis if one has already been run.
Below that, the panel repeats the Problem's Detected, Duration, and Severity fields for quick reference.
Comments
At the bottom of the page, a Comments section lets you and your team leave notes directly on the Problem, so context from an investigation stays attached to the incident instead of getting lost in chat.
 +1-415-800-4104