
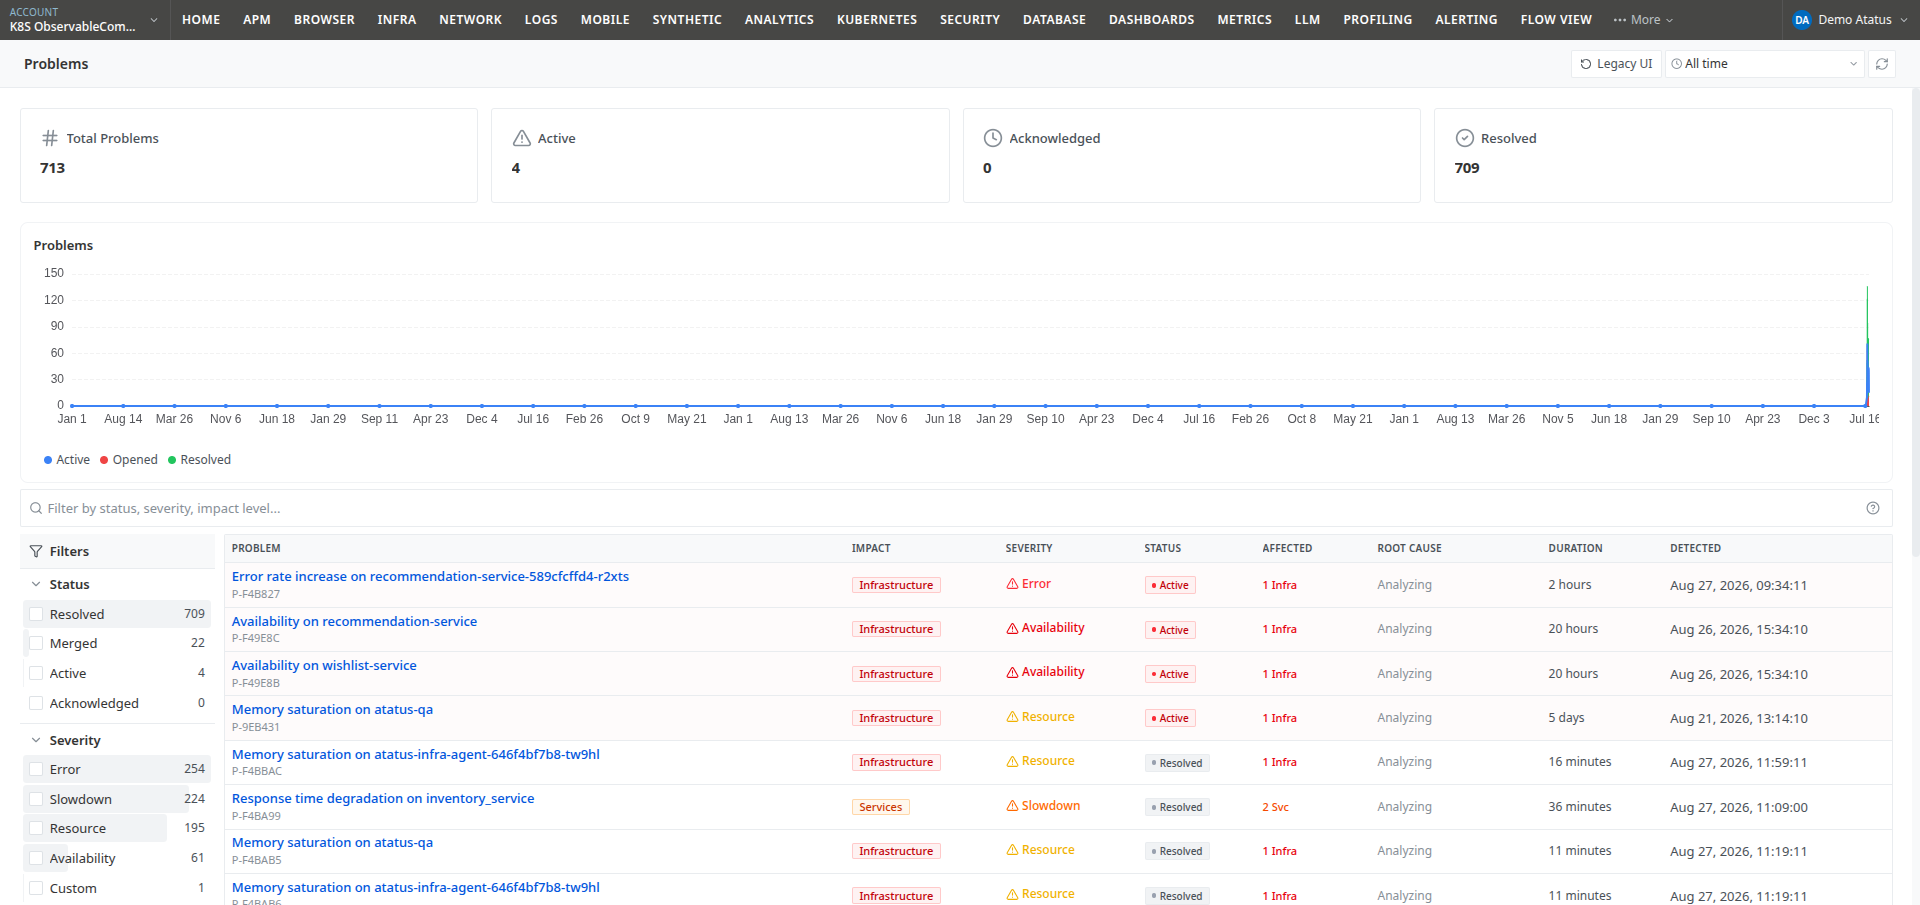
When something goes wrong in your stack, it rarely trips just one alert. A slow database query can push up response times on one service, which then causes timeouts and errors on every service that calls it. Instead of leaving you to piece together several separate alerts by hand, Atatus automatically groups the ones that belong together into a single Problem: one place to see what broke, what it affected, and why.
What a Problem is
A Problem represents one real-world incident, built from one or more correlated issues: the individual alert breaches (the same issues you'd see on the Issues page) that Atatus has determined are related to each other, either because they happened in the same window on connected services, or on the same host, pod, or workload.
Within a Problem, each correlated issue is tagged as one of the following:
| Tag | Meaning |
|---|---|
| Root cause | The issue Atatus believes triggered the incident |
| Symptom | An issue that resulted from the root cause, rather than causing it |
For example, say slow database queries on order_service cause response times to degrade on both order_service and the inventory_service that calls it. Atatus opens one Problem, tags the database issue as the root cause, and tags the two response-time issues as symptoms, so you get one incident with a clear cause instead of three unrelated alerts to piece together yourself.
Key concepts
| Field | Description |
|---|---|
| Problem | The title Atatus generates for the incident, for example "Response time degradation on inventory_service" |
| Impact | The category of what's affected: Infrastructure or Services |
| Severity | The kind of degradation detected: Error, Slowdown, Resource, Availability, or Custom |
| Problem Type | A more specific classification, such as Error rate increase, Response time degradation, Memory saturation, CPU saturation, Web Throughput, or Availability |
| Affected | How many applications, services, or infrastructure components are impacted |
| Root Cause | The entity Atatus has pinpointed as the source, once automatic correlation or AI analysis has confirmed one |
| Status | Where the Problem is in its lifecycle, see below |
Status lifecycle
A Problem moves through the following states:
- Active: Atatus has detected the Problem and it's still ongoing.
- Acknowledged: someone on your team has acknowledged they're aware of it and working on it.
- Resolved: the underlying issues have cleared, either automatically or because a user resolved the Problem manually.
- Merged: Atatus determined that a newer Problem is really a continuation of an existing one, for example the same recurring failure flaring up again, and folded it into the original Problem instead of opening a duplicate. A merged Problem keeps its own page, but shows a banner pointing to the Problem it was merged into.
Next steps
- Viewing & Filtering Problems: browse, search, and filter every Problem.
- Problem Details: what you see when you open a single Problem.
- AI Root Cause Analysis: run a deeper, AI-powered investigation on any Problem.
 +1-415-800-4104