
The Problems view provides an incident-centric view of your architecture. Instead of browsing your system topology to find degraded components, this view starts with currently active Problems and maps them directly to the entities involved.
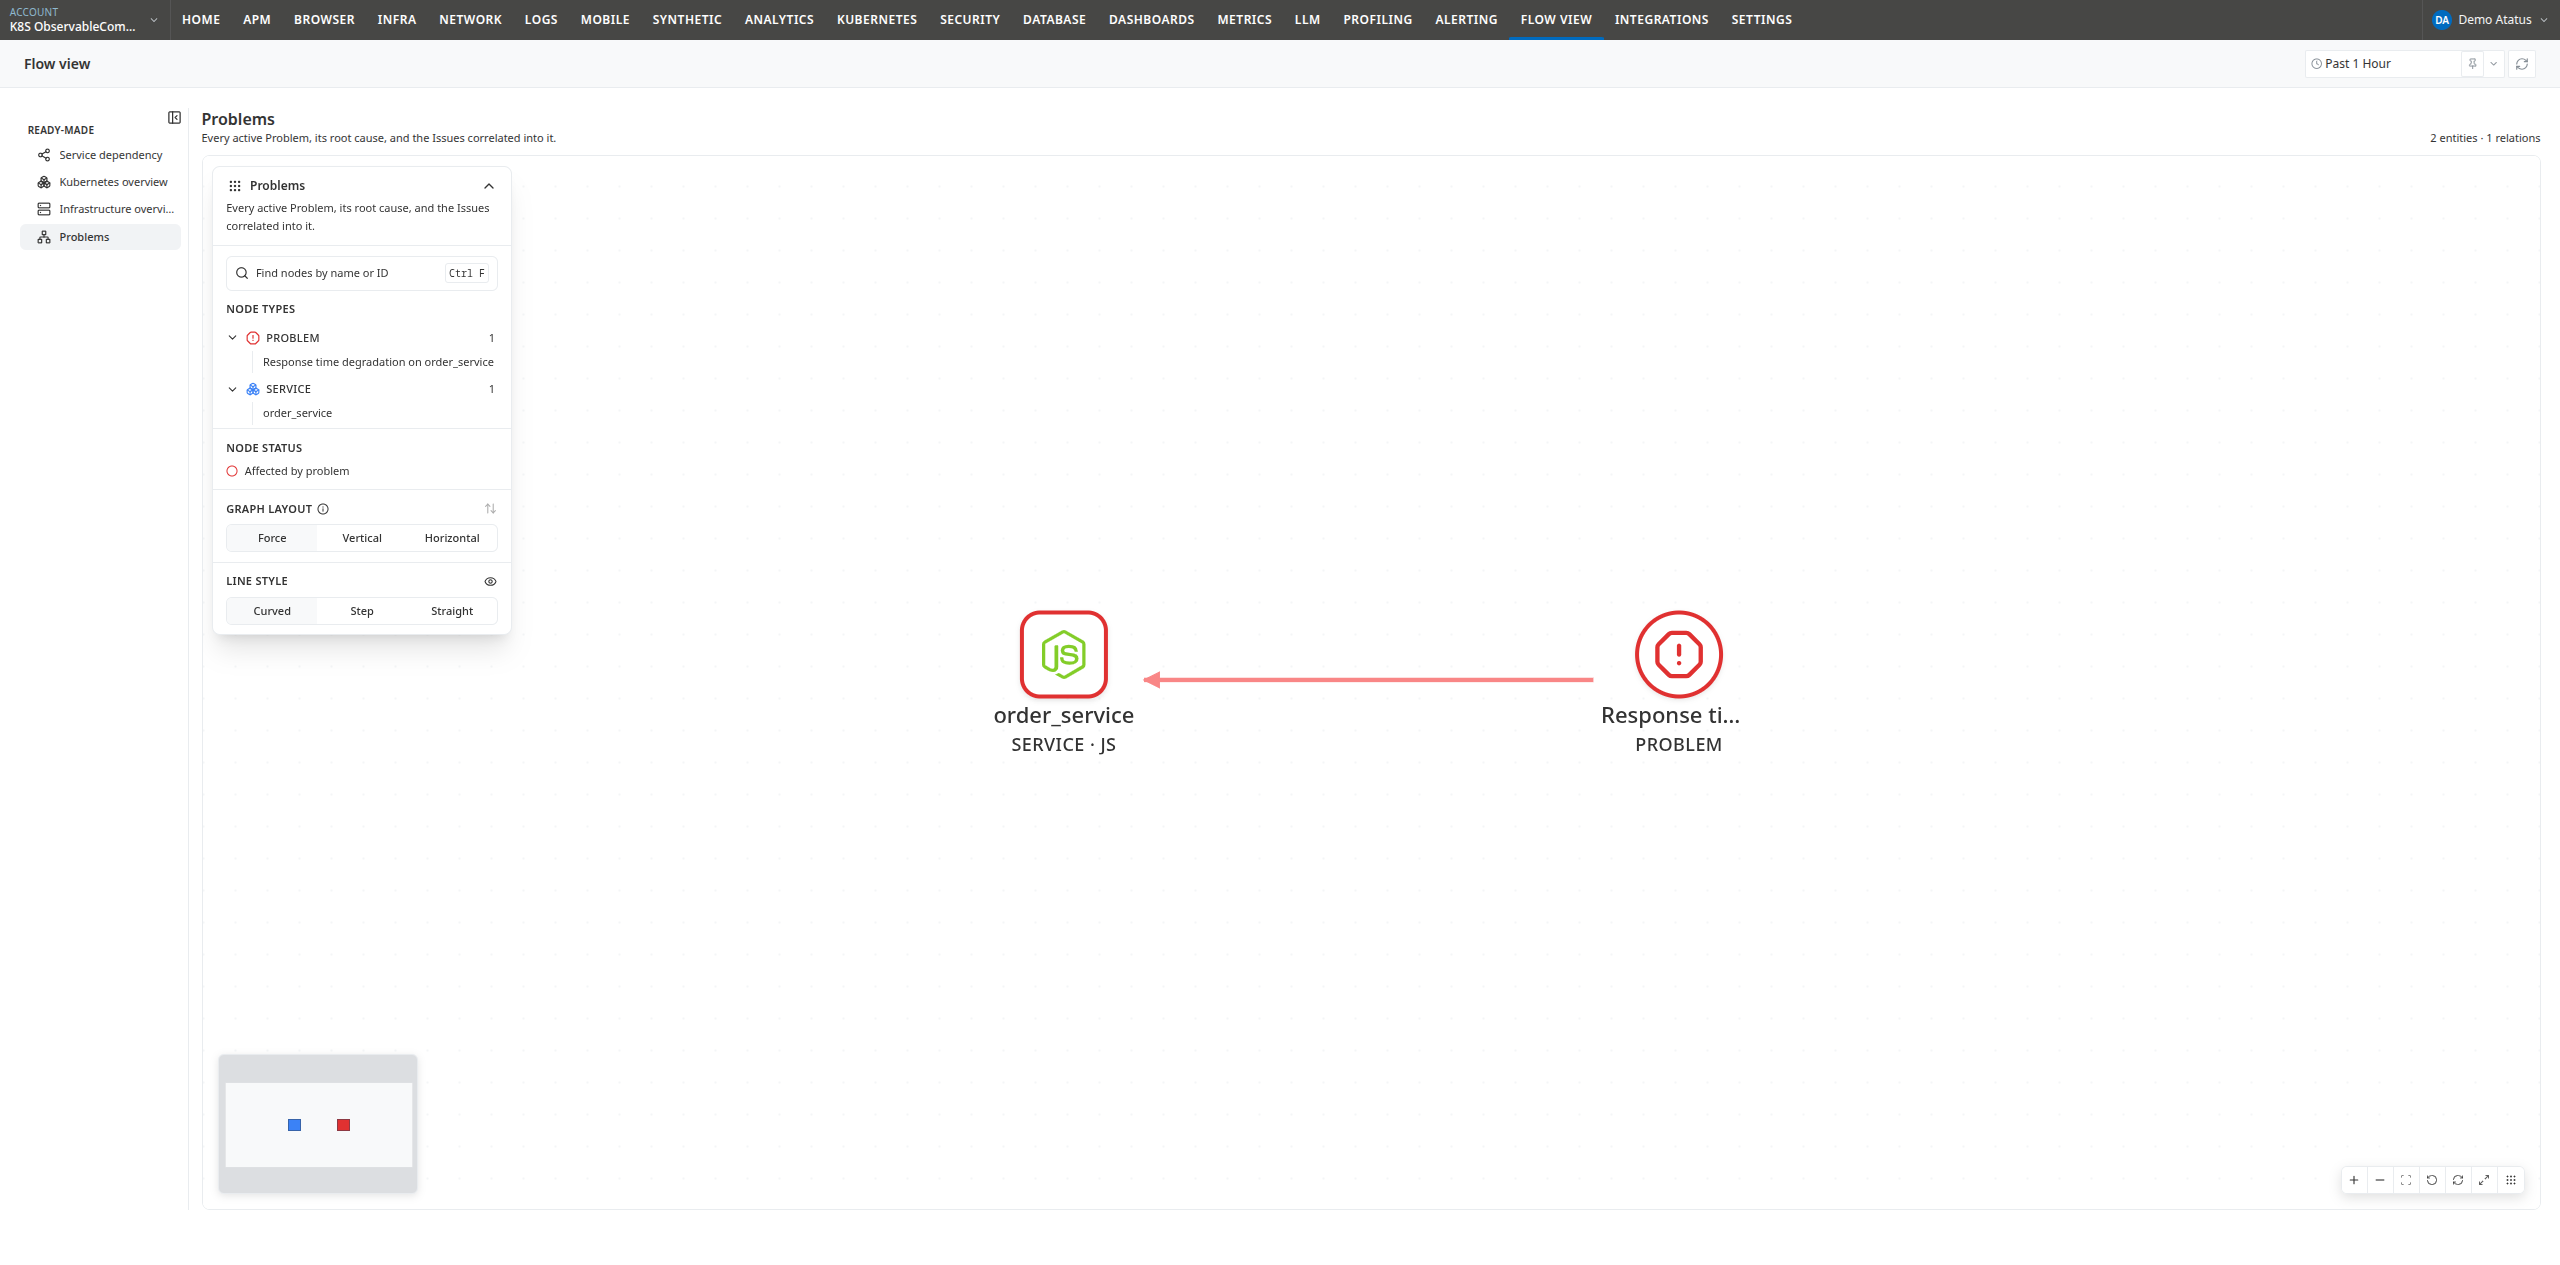
What is on the map
The view displays all Problems that are currently Active, Acknowledged, Detected, Opened, or Root-Cause-Identified, connected to the affected architecture entities:
| Line Style | Meaning |
|---|---|
| Red, solid | Root cause (ROOT_CAUSE): Points directly to the entity identified as the primary trigger of the incident |
| Amber, dotted | Evidence / Symptom (EVIDENCE, AFFECTS): Points to secondary entities affected by correlated Issues |
A Problem node is represented by a red octagon icon and displays the automated Problem title (e.g., Response time degradation on order_service).
Connected entities (such as services, hosts, and pods) retain their standard Flow View icons and colors, showing at a glance which component caused the incident and which downstream systems are impacted.
Individual alert Issues are not rendered as standalone nodes. Instead, correlated Issues are reflected as amber evidence connections directly pointing to the affected entities, which display an amber warning badge. To view individual Issue details, open the Problem panel.
An empty Problems map indicates that no active incidents or correlated Problems exist within the selected time range.
Investigating from any view
Any entity with an active Problem or open Issue features an Investigate problem action on its info card across all four Flow View maps. You can begin investigating an incident immediately from the Service Dependency, Kubernetes, or Infrastructure views without navigating away.
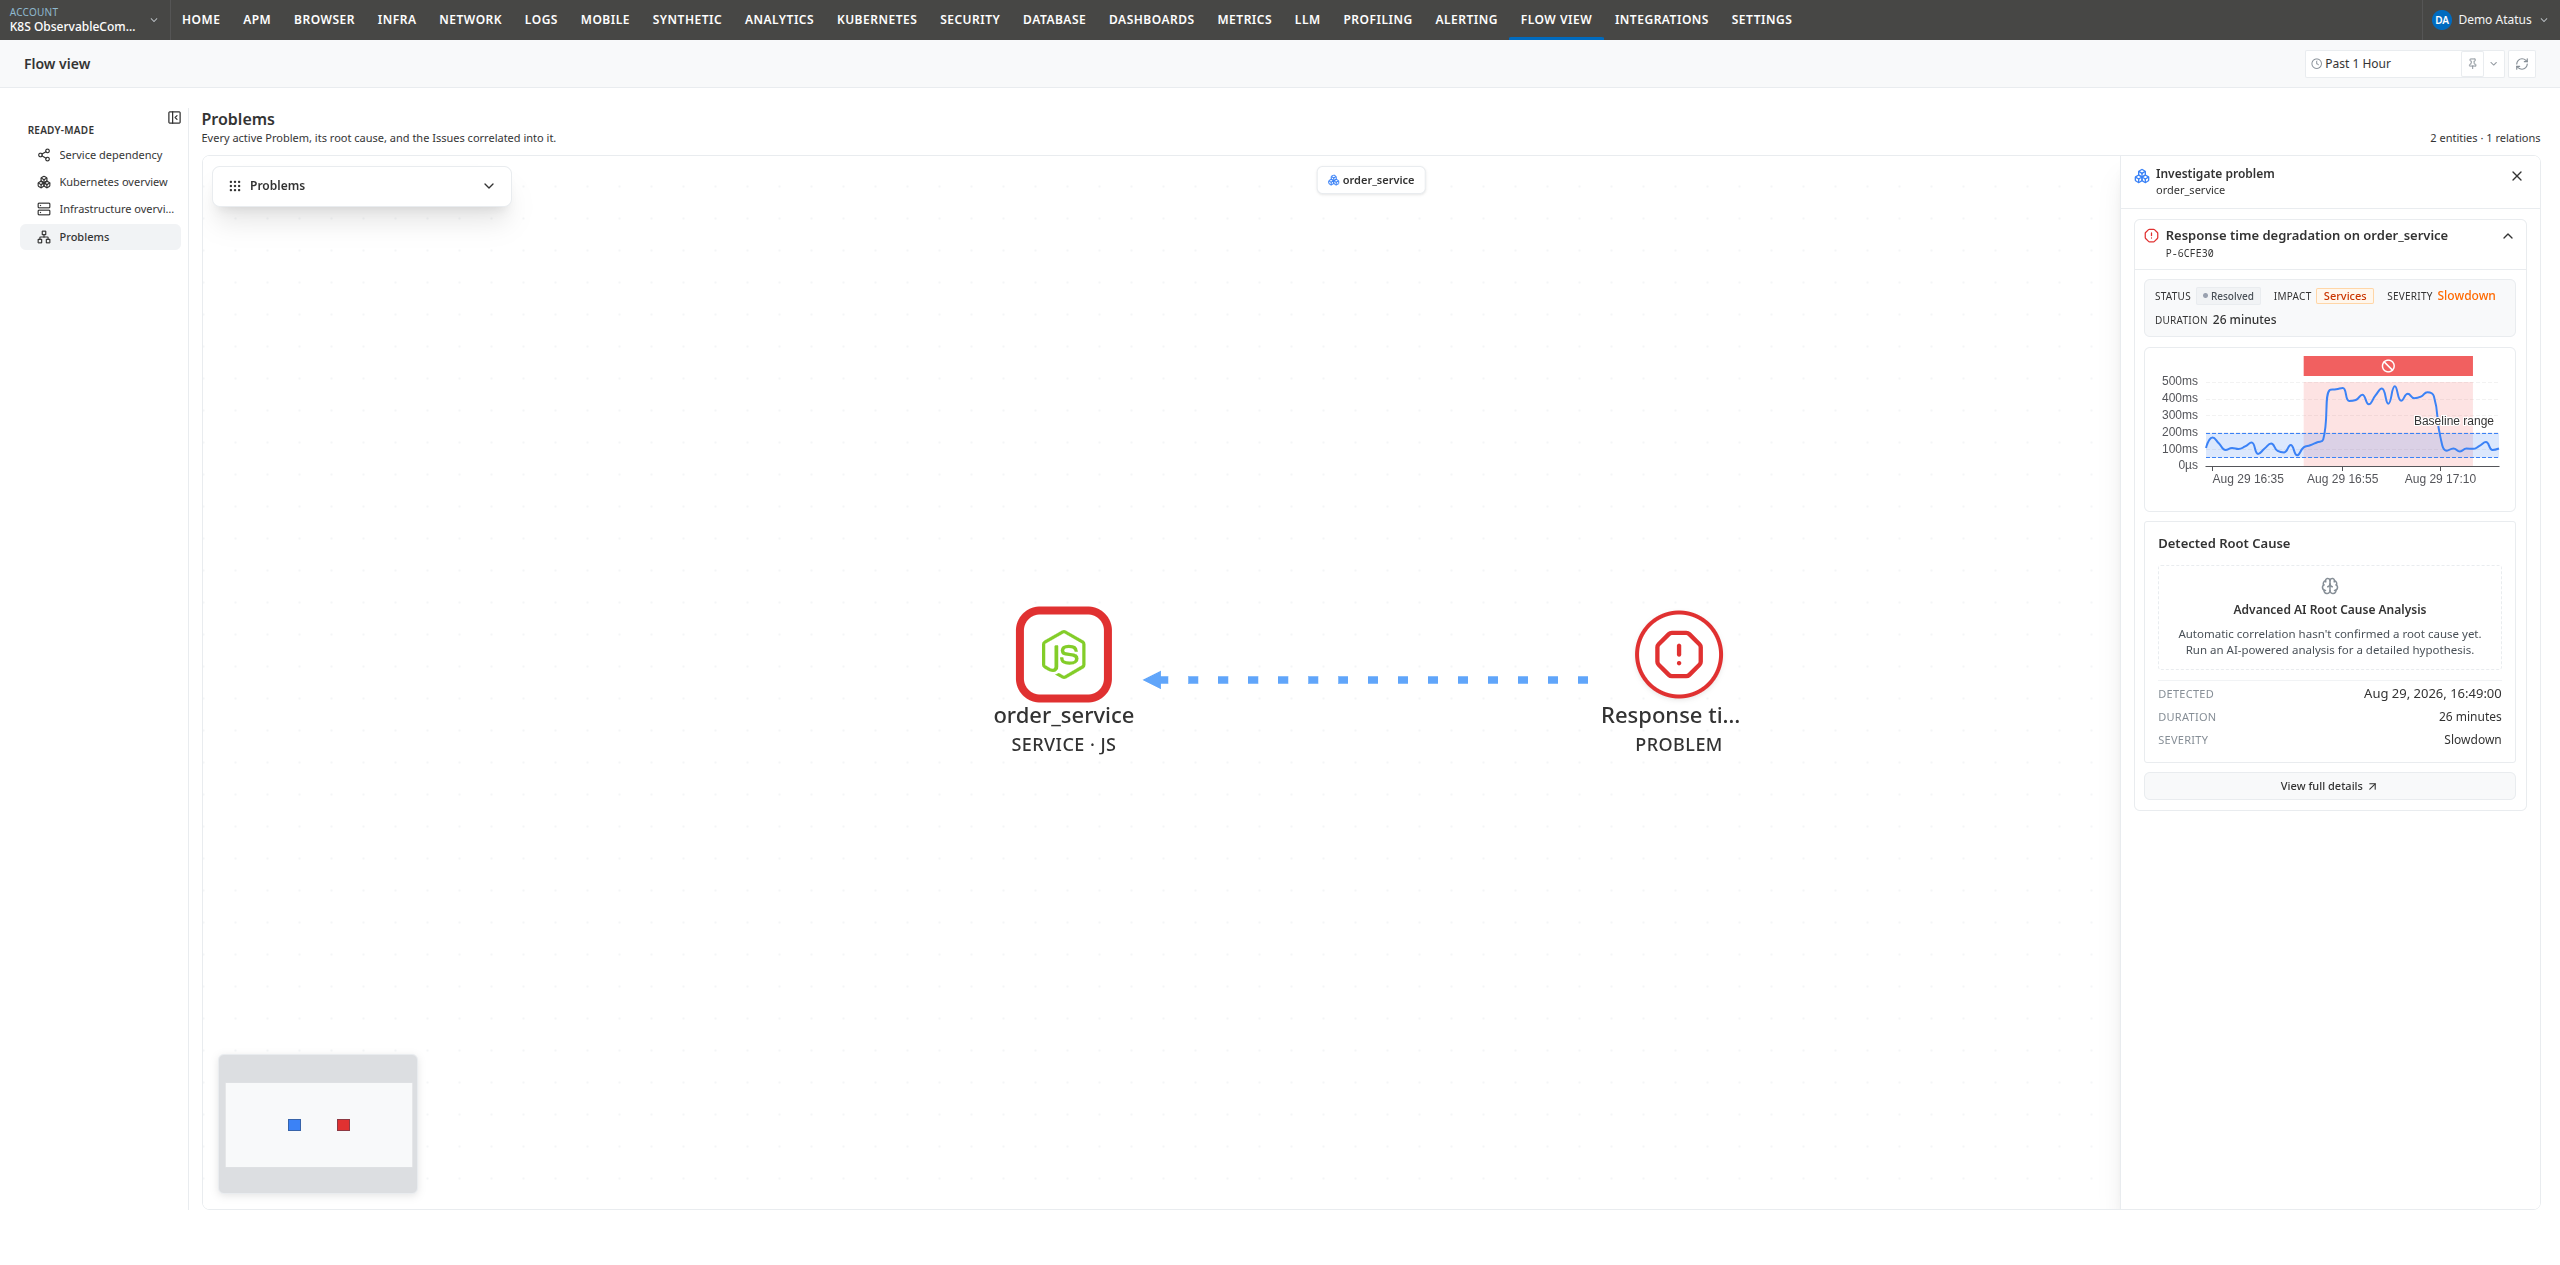
Clicking Investigate problem opens the side drawer containing:
| Section | Description |
|---|---|
| Status | The current lifecycle state (e.g., Active, Acknowledged, Resolved) |
| Impact | The affected category (Services or Infrastructure) |
| Severity | The type of degradation (Slowdown, Error, Resource, Availability, or Custom) |
| Duration | The elapsed time since the Problem was first detected |
| Metric Chart | The breaching metric plotted against historical baseline thresholds, highlighting the anomaly window |
| Detected Root Cause | The primary root-cause entity identified by automated correlation, along with the causal propagation path |
If multiple Problems affect the same entity, the drawer lists each incident by its short ID (P-XXXXXX) for individual review.
When automated correlation requires deeper diagnosis, click Advanced AI Root Cause Analysis to launch an AI-driven incident investigation.
Click View full details to open the dedicated Problem Details page in a new browser tab. Close the side drawer by clicking the close icon (X), clicking outside the drawer, or pressing Esc.
Layouts
The Problems view supports three layout modes:
- Force (default): Automatically spaces distinct incidents and their affected entity clusters apart, making multiple concurrent incidents easy to isolate visually.
- Vertical: Arranges Problems above their root causes and affected dependencies.
- Horizontal: Arranges Problems to the left of their root causes and affected dependencies.
Troubleshooting workflow
- Open the Problems view and select the relevant time range in the top-right header.
- Identify the red octagon Problem nodes. Follow the solid red line to pinpoint the detected root-cause entity.
- Follow the dotted amber lines to evaluate the incident blast radius across downstream services, hosts, and pods.
- Click the root-cause entity and select Investigate problem to review metric charts, baseline deviations, and incident severity in the side drawer.
- If multiple Problems link to the same entity, prioritize investigating that common dependency.
- Click View full details for in-depth analysis, or switch to the Service Dependency view and isolate the root-cause service to evaluate downstream caller impacts.
Next steps
- Problems Overview: Learn how Atatus automatically correlates alert Issues into Problems.
- Service Dependency: Trace the incident blast radius across upstream and downstream services.
 +1-415-800-4104