
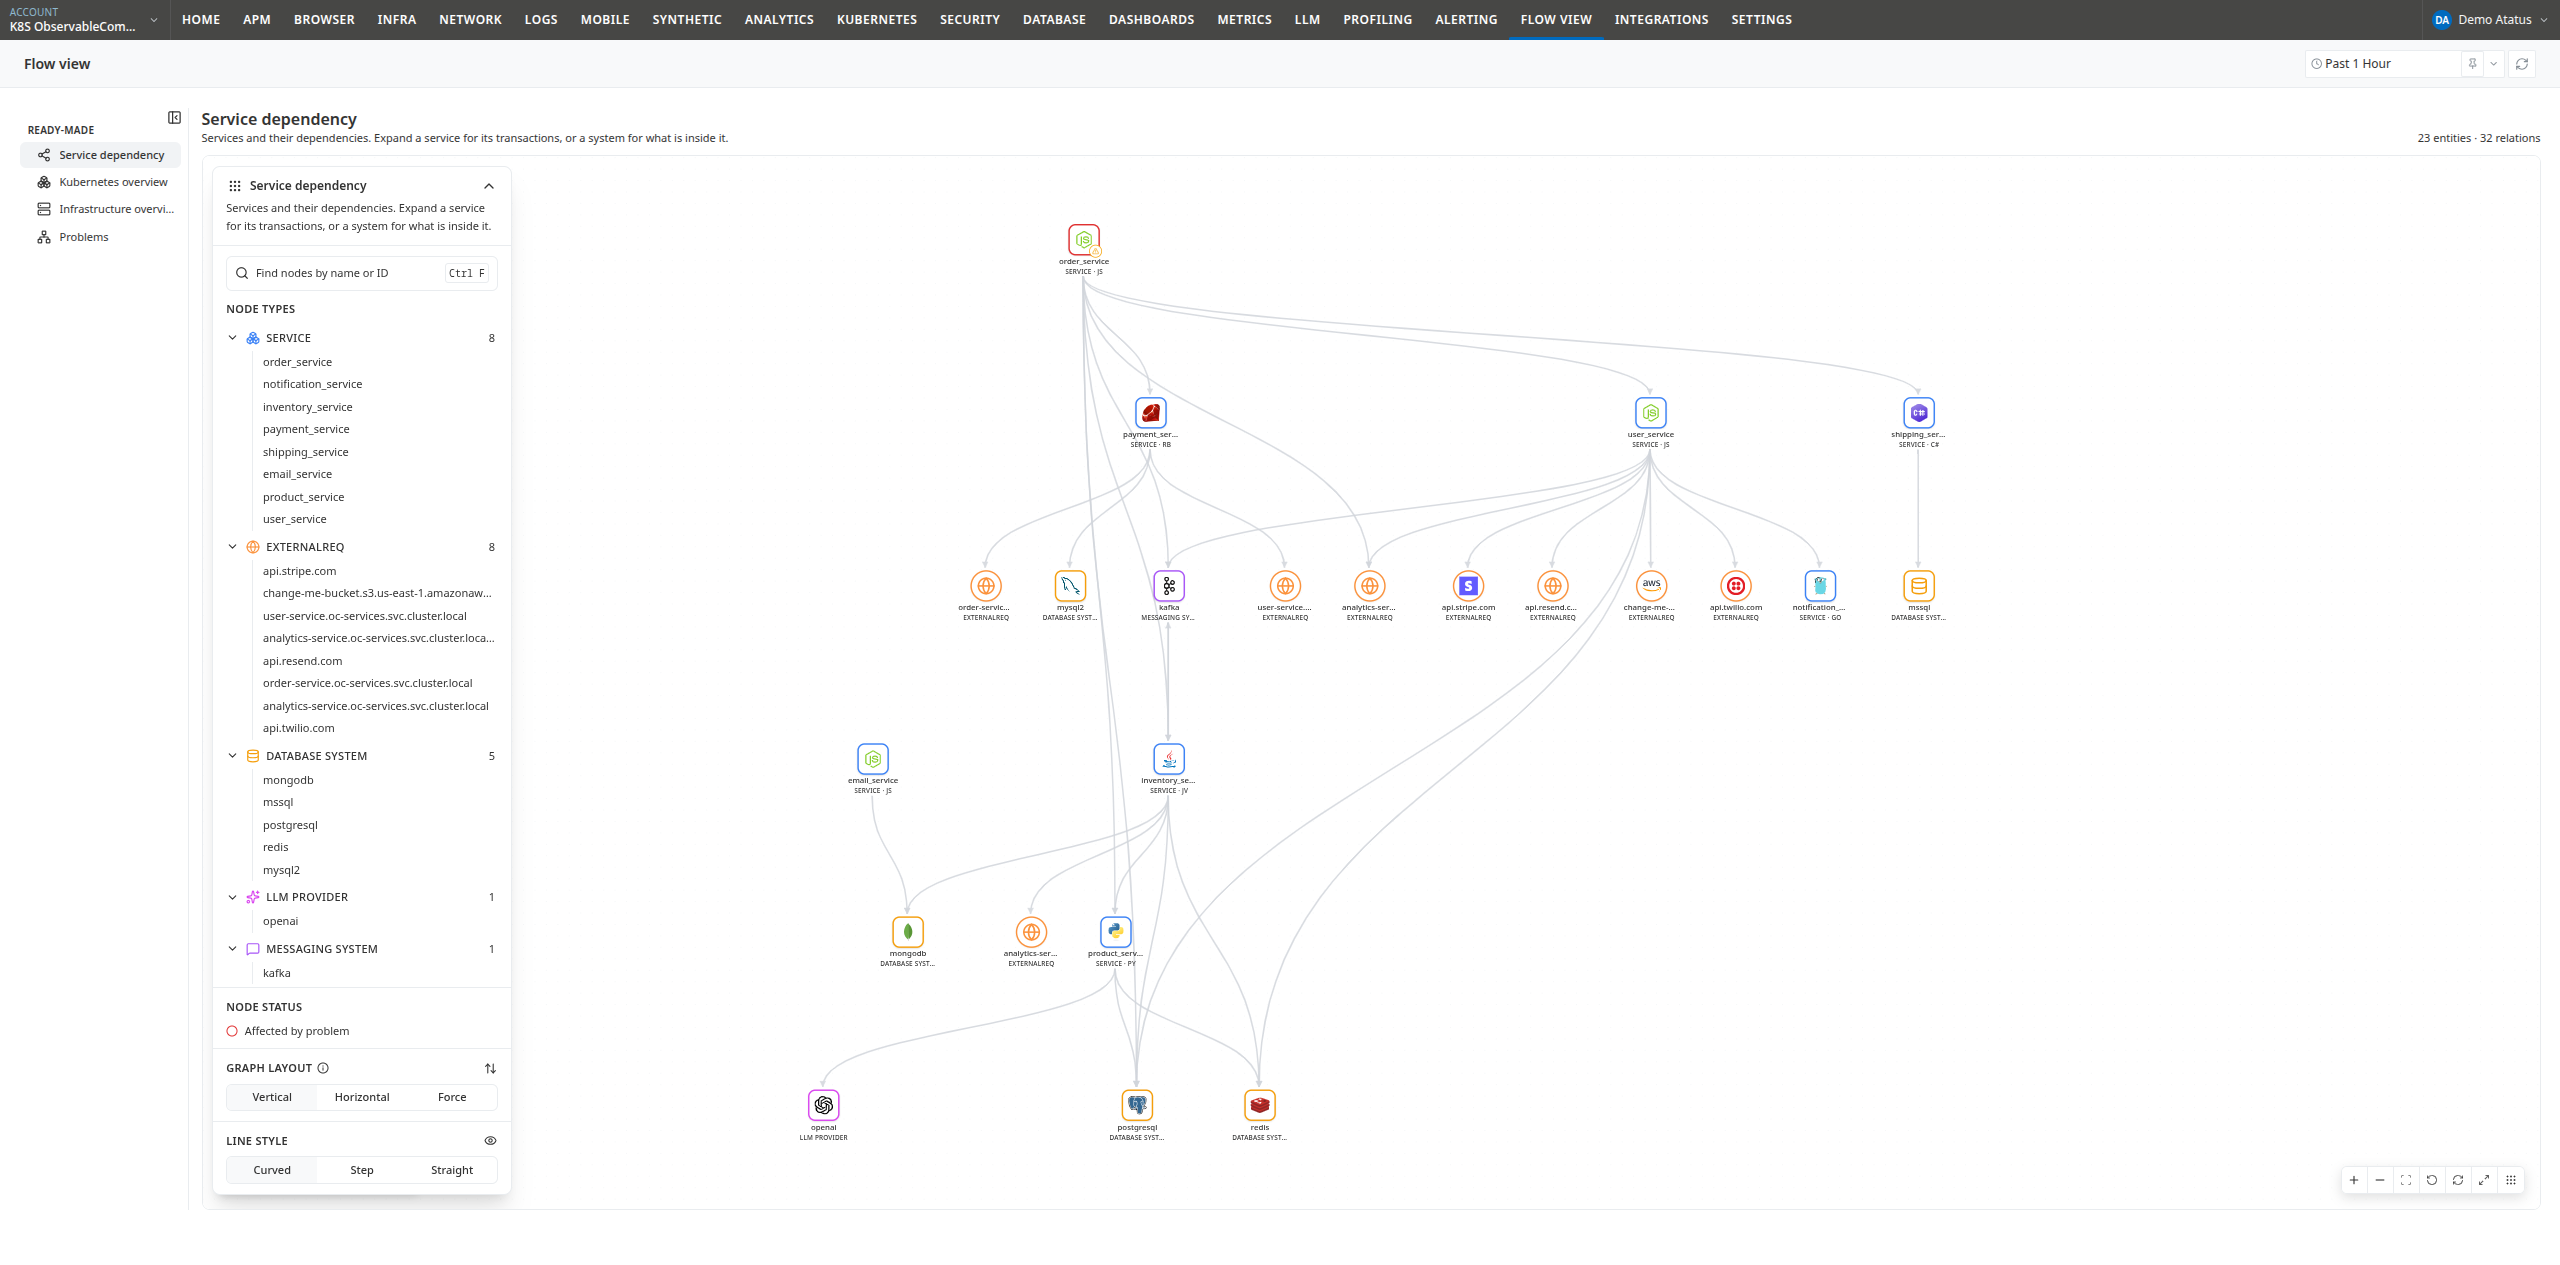
The Service Dependency view is the default Flow View map. It visualizes all services reporting to APM alongside their connected dependencies—including databases, message queues, caches, third-party APIs, and downstream services—allowing you to understand complete request flows and architectural dependencies without inspecting individual traces.
What is on the map
The view initializes with the following primary entity types:
| Entity Type | Description |
|---|---|
| Service | An application monitored by APM, labeled with its runtime language (e.g., SERVICE · JS, SERVICE · PYTHON) |
| Database system | A database technology queried by services (e.g., postgresql, mongodb, mysql2) |
| Messaging system | A message queue or event streaming broker (e.g., kafka, rabbitmq) |
| Cache | An in-memory caching system (e.g., redis, memcached) |
| LLM provider | An external AI or LLM service invoked by applications (e.g., openai, anthropic) |
| ExternalReq | An external HTTP/HTTPS dependency or unmonitored service endpoint (e.g., api.stripe.com) |
An ExternalReq node represents an outbound call to an unmonitored endpoint. If an internal service address (such as user-service.oc-services.svc.cluster.local) appears as ExternalReq, the destination service is either uninstrumented or reporting under a different service name. Instrumenting that service with Atatus APM resolves the node into a monitored Service and completes the call path.
Expanding a service
Double-click a service node to expand its transactions—the individual HTTP endpoints and background jobs it serves—rendered as child nodes within the service container.
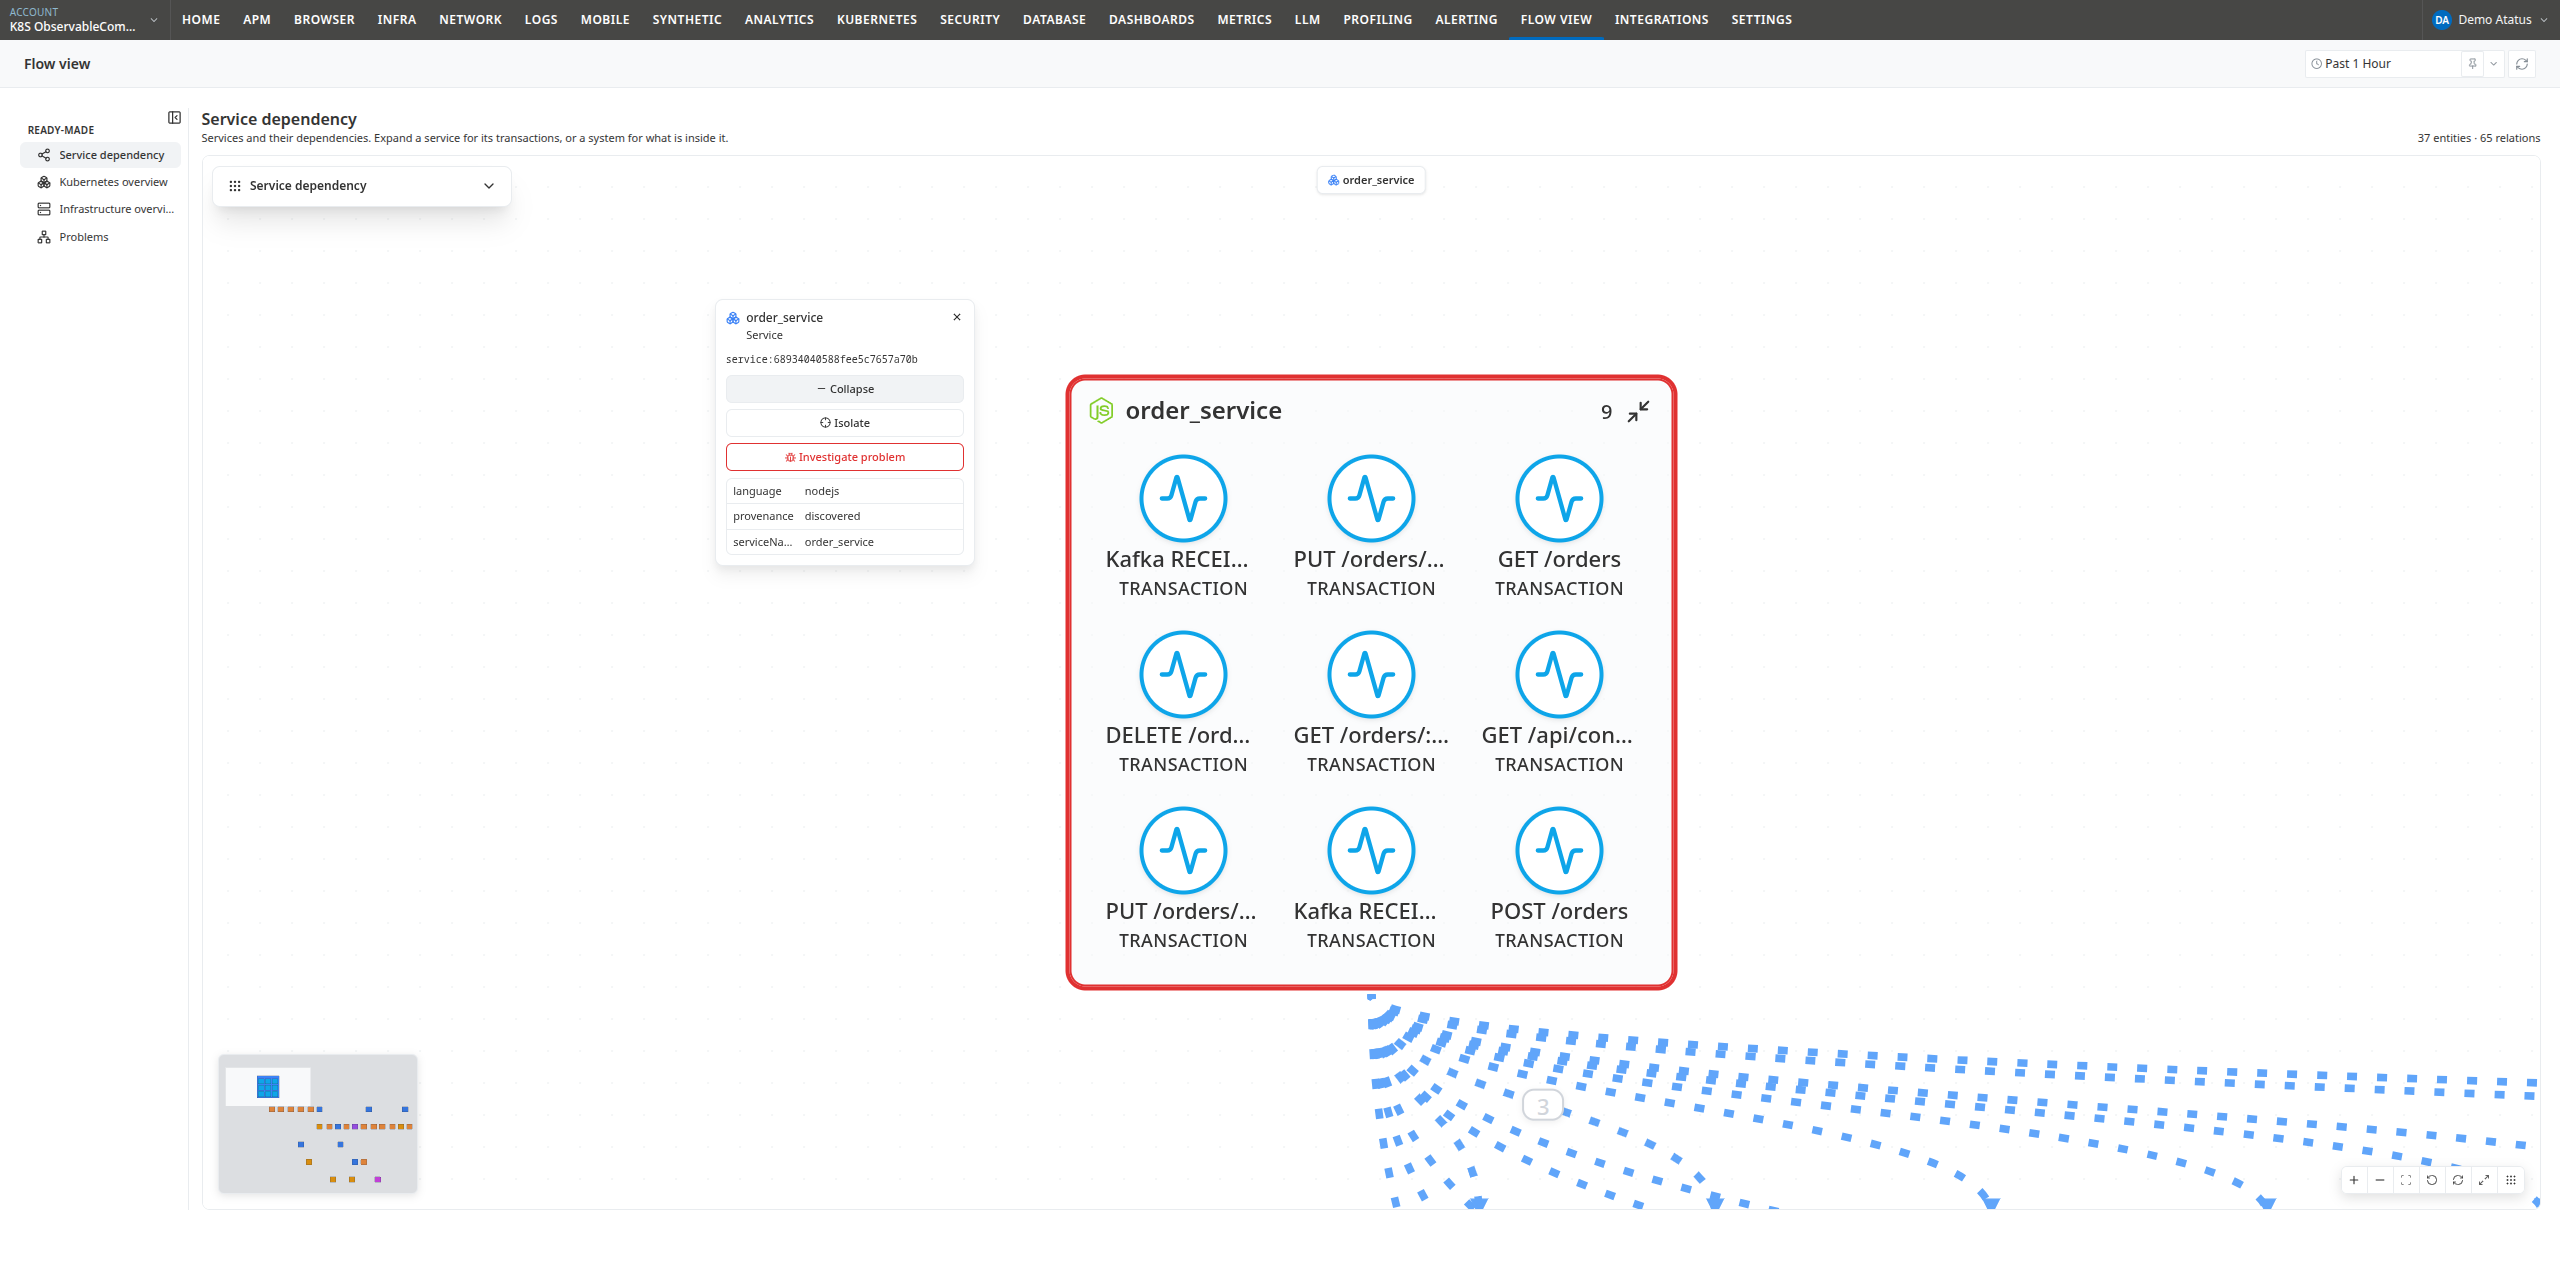
When collapsed, a service displays an aggregated connection line to its dependencies (e.g., a single line to postgresql). When expanded, individual transactions reveal granular connections to the exact databases, message queues, or downstream services they invoke.
Expanding a Database system, Messaging system, or LLM provider similarly exposes the specific databases, topics, or AI models configured within that system.
Individual service instances (hosts or containers) are omitted from this view to keep the application topology focused. To inspect the underlying compute infrastructure hosting a service, use the Kubernetes Overview or Infrastructure Overview views.
Isolating a service
To focus on a specific service in a complex topology, select the service and click Isolate on its info card. Flow View filters the canvas to show only that service, its transactions, and its direct 1-hop upstream and downstream dependencies, removing unrelated entities from view.
Click Clear isolation at the bottom of the canvas to restore the complete topology.
Layouts
The Service Dependency view supports three layout modes:
- Vertical (default): Arranges services hierarchically with upstream callers above and downstream dependencies below. Click the active layout button to invert the flow direction.
- Horizontal: Arranges services with upstream callers on the left and downstream dependencies on the right. Click the active layout button to invert the flow direction.
- Force: Uses physics-based clustering to naturally position interconnected services and dependencies.
Reading the lines
In the Service Dependency view, lines represent application dependencies and communication paths:
| Line Style | Relationship Type | Meaning |
|---|---|---|
| Grey, solid | CALLS |
Direct service-to-service, database, message queue, cache, or external HTTP calls |
| Grey, dotted | CONNECTED_TO |
Logical connection to a system without a direct request-level trace |
- Selection highlight: Clicking any service or dependency illuminates its connected lines in animated blue and dims unrelated nodes.
- Line details: Click any line to open a details card displaying the source service, destination dependency, and relationship type.
- Uniform thickness: Line thickness is uniform across all connections; lines indicate that a dependency exists rather than request volume or throughput.
Troubleshooting workflow
When troubleshooting a degraded service (e.g., high response times on order_service):
- Open the Service Dependency view and locate
order_serviceusing the canvas or search box (Ctrl/⌘+F). - Click the service to select it. Its immediate dependencies highlight while unrelated nodes dim, revealing the direct dependency path.
- Check the health borders of connected dependencies. A red border indicates the root cause of an active Problem; an amber border indicates an open Issue.
- Double-click
order_serviceto expand its transactions and identify which specific endpoint communicates with the degraded dependency. - Click the degraded dependency and select Investigate problem on its info card to view incident diagnostics directly on the map.
- Click through to APM from the info card to inspect detailed transaction traces, error rates, and metric breakdowns.
Next steps
- Navigating the graph: Canvas interactions, searching, and keyboard shortcuts.
- Problems View: Investigate active incidents directly from root-cause entities.
 +1-415-800-4104